

Monarch Health Annual Results
Every year, we compile all of the data from our community scientists and analyze it to determine what trends are emerging. Starting in 2011, we began our annual newsletter, which we send out to all participating volunteers. These newsletters highlight the trends from the year, as well as provide an update on the Monarch Health team. Click on the year below to see a recap of the results, plus a link to that year's newsletter.


.png)
2020 Results

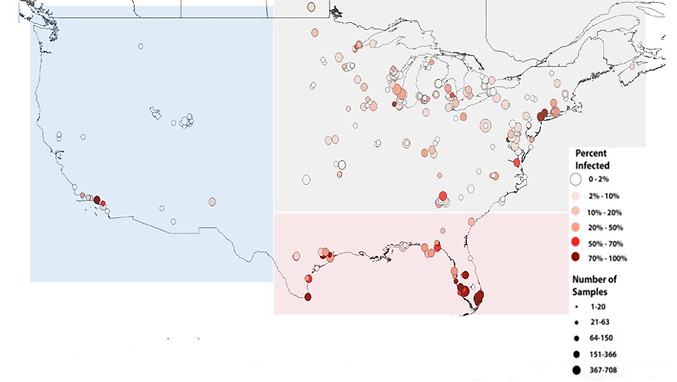
In 2020, community scientists collected 6417 samples for Project Monarch Health. The average number of samples per volunteer was 38.66. Infection prevalence by the protozoan OE was 24.8% across all samples, with highest infection prevalence occurring in the southern US, in regions with resident, non-migratory monarch populations.
2019 Results
In 2019, community scientists collected 9525 samples for Project Monarch Health with a record number of states and provinces sampled!. The average number of samples per volunteer was 53. Infection prevalence by the protozoan OE was 20% across all samples, with highest infection prevalence occurring in the southern US, in regions with resident, non-migratory monarch populations.
2018 Results
In 2018, community scientists collected a record number of samples for Project Monarch Health, and monarchs numbers reached at 12-year high in Mexico! 207 volunteers from 32 US states and 2 Canadian provinces submitted 10,497 samples to Project Monarch Health. The average number of samples per volunteer was 50.71. Infection prevalence by the protozoan OE was 24.6% across all samples, with highest infection prevalence occurring in the southern US, in regions with resident, non-migratory monarch populations. Just under 60% of these samples were heavily infected, down from the previous year. The prevalence in eastern migratory populations was up from last year at around 20%.
2017 Results

In 2017, 225 volunteers tested 7,356 monarch butterflies for the protozoan parasite Ophryocystis elektroscirrha (OE). Our citizen scientists sampled across 29 states in the US and 2 provinces in Canada. Both the southeastern US and California populations exhibited very high infection prevalences, both at 67%. In contrast, only 5% of the eastern migrants were heavily infected with OE.
2016 Results

In 2016, 152 Monarch Health volunteers sampled 5,832 monarchs for OE. This season we saw a rise in OE prevalence in all migratory regions except the Midwest. Notably, the West rose from 20% in 2015 to 37% in 2016 while the South and Northeast appear to be returning to the average prevalence of 10% previously maintained by these populations from 2005-2013. The non-migratory populations in South Florida, and along the Pacific and Gulf Coasts are still maintaining high OE infection levels, however the Pacific did drop significantly from 68% in 2015 to 43% in 2016.
Overall, we see higher OE prevalence in these monarchs because they are not migrating. This means that they cannot escape infected milkweed and sick individuals are not weeded out by the strenuous long-distance migration. Disease builds up in these populations, particularly when tropical milkweed (A. curassavica) is present to facilitate year-round breeding.